
By Eric Wright
TechForward.io Practitioner Series
December 22, 2025
Hey fellow terminal enjoyers and log wranglers! I’m fresh off creating a bunch of content from KubeCon NA 2025 in Atlanta where I spent way too much time geeking out at booths. One tool that absolutely sucked me in was Gonzo – an open-source, Go-powered TUI for real-time log analysis from the ControlTheory team.
As a hands-on practitioner who’s spent plenty of hours up to my neck in Kubernetes debugging sessions, piping logs through grep/awk/sed chains, and cursing at web-based observability UIs that lag under load, Gonzo felt like it was built for me. It’s just a blazing-fast terminal dashboard that turns log chaos into actionable insights. I demoed it live at the booth, installed it on my laptop that night, and have been hammering it on real workloads since. Here’s the nerdy breakdown from someone who’s actually using it.
Why Gonzo Hits Different in Real-World Debugging
Logs in distributed systems (K8s, especially) are a firehose: structured JSON, unstructured text, mixed severities, and patterns that only emerge after staring long enough. Tools like stern or kail help with multi-pod tailing, k9s is god-tier for resource nav, but when you need to analyze (spot severity spikes, word correlations, or temporal bursts) you’re often back to scripting or exporting to something heavier.
Gonzo fills that exact gap with a Terminal UI (TUI) that’s responsive even on high-throughput streams. It’s not trying to be a full observability platform; it’s the surgical tool for when you’re in the trenches triaging an incident or profiling a new deployment.
Repo: https://github.com/control-theory/gonzo (MIT licensed).
Core UX and Features That Make It Addictive
The default view is a responsive 2×2 grid that’s pure eye candy in a dark terminal:
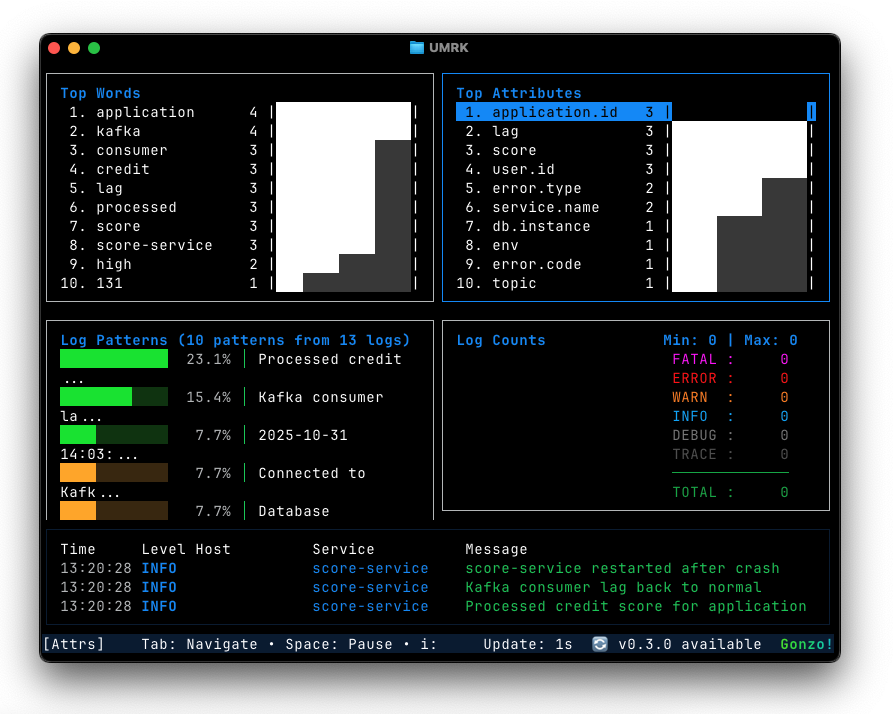
- Bottom-left: Live log stream with color-coded severity and timestamp alignment.
- Top-left: Real-time severity pie chart (updates every few seconds).
- Top-right: Word frequency cloud/heatmap – instantly surfaces repeating terms like “connection refused” or “OOMKilled”.
- Bottom-right: Timeline with density bars for log volume.
Navigation is k9s-familiar: hjkl/vim keys, mouse support, / for search, Space to pause/resume. Hit Enter on a line for a full-screen detail view.
The heatmap view (toggle with h) is where it gets seriously useful for spotting anomalies:
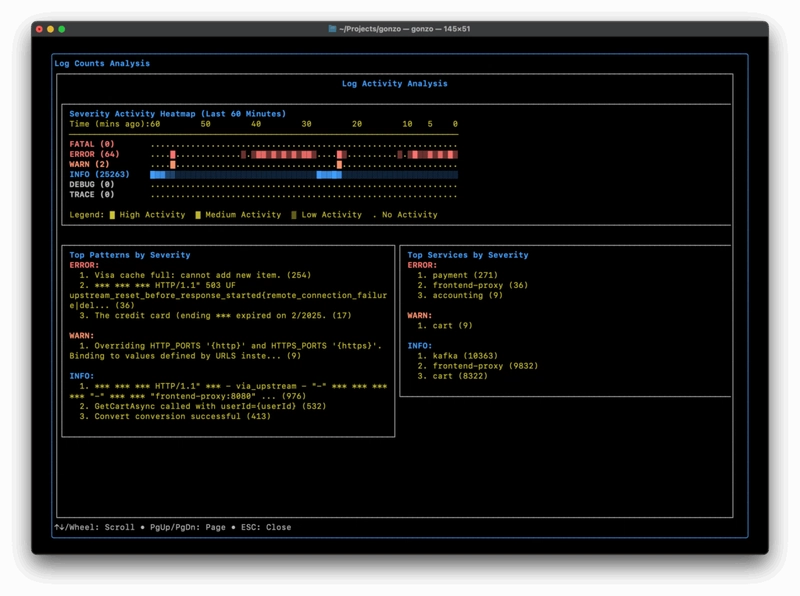
ASCII-art intensity map of severity over time – red clusters scream “retry storm starting here” without scrolling through thousands of lines.
And the stats modal (s on selected line) gives parsed attributes if your logs are structured:
Practitioner Tips: How I’m Actually Using It
Installation is trivial:
go install github.com/control-theory/gonzo/cmd/gonzo@latest
# or
brew install gonzo  # if on macOS/Linux with Homebrew tap
Basic usage:
kubectl logs -f deploy/my-app -n prod | gonzoPro moves:
- k9s integration: Add the plugin – Ctrl-L on a pod launches Gonzo directly on its logs.
- OTLP receiver mode: Run Gonzo as a sidecar or local proxy to ingest OpenTelemetry logs directly (
gonzo --otlp-enabled). - Local AI hook: Point it at Ollama or LM Studio for on-demand summaries (“explain this burst”) – zero cloud cost, privacy-centric, and fully offline.
- Multi-source: Supports any log file format and integrates super easy to K8s.
I’ve been using it for:
- Quick triage of OOM loops in ML training jobs (word freq instantly shows the offending container name repeating).
- Validating log structure during Otel instrumentation rollouts.
- Teaching new team members pattern recognition without spinning up Grafana/Loki.
Performance is stellar – handles high throughput streaming and large logs on my M1 MacBook with nominal CPU and memory requirements.
Bottom Line from the Trenches
Gonzo proves that the ControlTheory team knows their customer well. The execution is spot-on for practitioners who live in tmux + kubectl. It’s the tool I wish I’d had during countless 3am incidents. If you’re a DevOps engineer, SRE, or platform builder dealing with logs daily, install it today. You’ll wonder how you lived without that heatmap.
Go star the repo, drop a PR if you add something cool, and let’s keep building better tools for the rest of us.
What’s your current log debugging stack? Hit the comments – always hunting for more terminal magic.
